Three billing models dominate Network as a Service contracts: per square foot, per user, and per device or port. Use per user as your fastest budgeting proxy when headcount drives your network need, per square foot when you’re covering multi-site floor area, and per device or port when your equipment count stays fixed. Scope varies significantly between providers, so always verify what’s actually included before comparing quotes.
TL;DR:
- Per user pricing is ideal for organizations with fluctuating staff numbers and predictable headcount-based network load.
- Per square foot charges suit large physical footprints like warehouses but may overstate costs if occupancy is low.
- Per device or port models work best for stable estates with fixed equipment counts, such as manufacturing floors or hospitality access points.
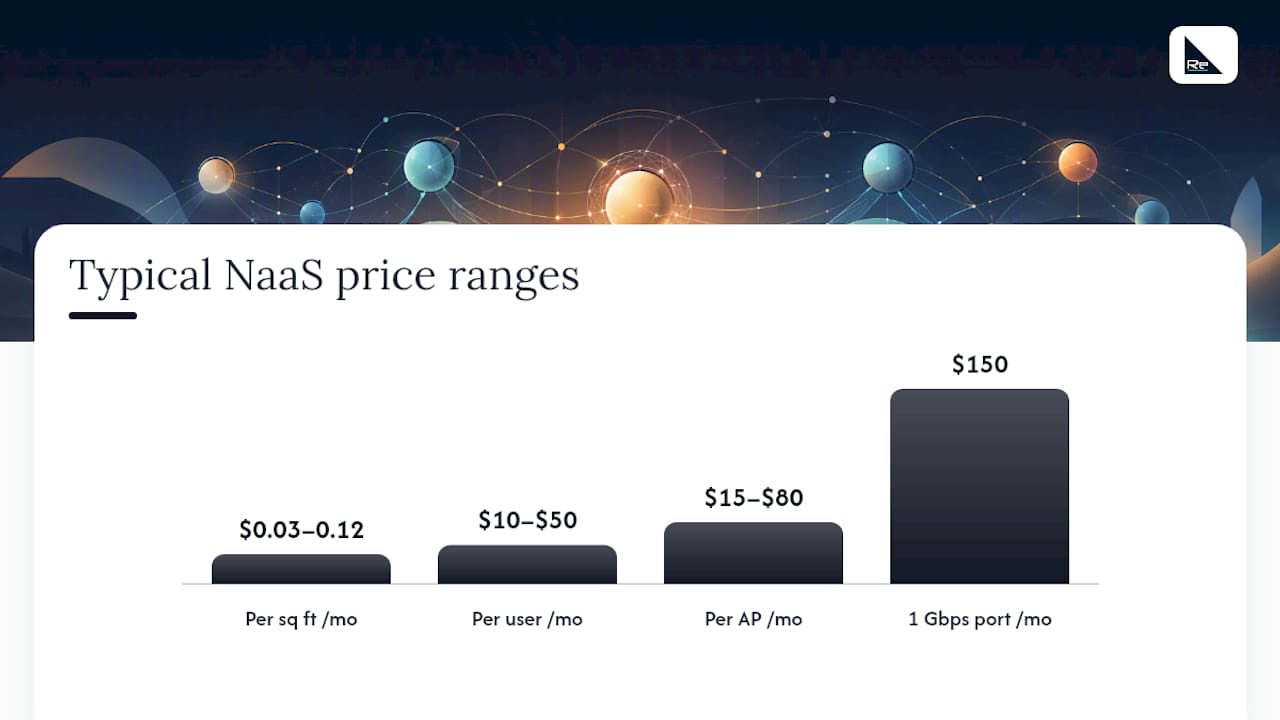
- Typical monthly rates range from $0.03 to $0.12 per square foot, $10 to $50 per user, and $15 to $80 per access point, with conversion between models possible through density ratios.
- Always verify which costs are included, especially hardware refresh, and normalize quotes to monthly OpEx before comparing vendors to avoid hidden charges.
Table of Contents
- Naas pricing models compared: fit, pros and cons
- What do naas pricing ranges typically look like?
- What’s included in a NaaS subscription, and what costs extra?
- What factors actually move your NaaS price?
- How do you build an apples-to-apples NaaS estimate?
- What procurement checks should you run before signing?
- Where procurement teams get NaaS pricing wrong
- Get an accurate NaaS estimate from Re-Solution
- Where to check NaaS pricing data yourself
- Sources
- FAQ
Naas pricing models compared: fit, pros and cons
Each model reflects a different way of measuring your network’s real cost driver, and picking the wrong one for your organisation makes every quote look distorted.
Per square foot charges you against your covered floor area, usually calculated per site per month. It suits organisations with large physical footprints and unpredictable headcount, such as warehouses, manufacturing plants, or retail chains where staff numbers fluctuate but the building doesn’t shrink.
Per user ties cost to the number of people connecting to the network, which makes it the natural fit for office-based organisations, schools, and shared workspaces where headcount is the clearest proxy for network load.
Per device or port bills against the number of connected endpoints, be that laptops, IoT sensors, or switch ports. This model works best where the device estate is stable and known in advance, such as manufacturing floors with fixed machinery counts or hospitality sites with a set number of access points.
- Per square foot: predictable for coverage planning, but can overstate cost if occupancy is low or space is used inefficiently.
- Per user: easy to forecast against HR headcount, but vulnerable to seasonal staff swings and remote working patterns.
- Per device/port: precise for fixed estates, but punishing for organisations adding IoT devices or BYOD policies without renegotiating.
The real negotiation lever sits in matching the model to your growth pattern. A logistics business adding warehouses should resist a per-user structure that penalises fluctuating shift patterns, while a school with a stable roll count can lock in per-user pricing with confidence.
What do naas pricing ranges typically look like?
Market pricing advisories commonly report per-square-foot rates of $0.03 to $0.12 per square foot monthly, per-user rates of $10 to $50 monthly, and per-access-point rates of $15 to $80 monthly, according to TeleGeography’s NaaS market data. Converting between models requires knowing your own ratios, roughly one access point per 1,500 to 2,500 square feet in a typical office, so a per-sq-ft quote can be sanity-checked against a per-AP quote for the same site.
Always ask whether a quoted figure includes or excludes that uplift.*
Three scenarios illustrate how this plays out:
- Small single office (50 users, 15,000 sq ft): expect a monthly total in the low thousands once switching, wireless, and basic support are bundled.
- Multi-site mid-market (five sites, 400 users): per-site base fees typically apply on top of per-user charges, so the true monthly figure often exceeds a naive per-user multiplication.
- Dense public space (a hospitality venue or shared workspace with heavy guest Wi-Fi): access point density drives cost more than headcount, making per-device the more honest comparison point.
Public sector procurement listings show a different pattern entirely. The UK’s Digital Marketplace lists NaaS day rates between £425 and £995 per instance, but that’s a short-term daily construct built for time-limited public contracts. Enterprise NaaS almost always runs as a fixed monthly subscription instead, so don’t try to convert a day rate into your annual budget without adjusting for that structural difference.
TeleGeography’s regional benchmarking also shows a European median of roughly $150 per month for a 1 Gbps port, giving you a reference point if your quote is structured around raw connectivity rather than seats or square footage.
What’s included in a NaaS subscription, and what costs extra?
A monthly NaaS price commonly bundles the following:
- Hardware refresh across the contract term, so ageing switches and access points get replaced without a separate capital request.
- Software licences covering the network operating system and management platform.
- Installation and configuration, including initial site setup and cabling where required.
- Ongoing monitoring, typically through a network operations centre watching for outages and performance drops.
- Support, ranging from basic ticketing to proactive fault resolution depending on tier.
Common extras that vendors quote separately include internet circuits from your chosen ISP, SD-WAN overlay services for multi-site connectivity, advanced security add-ons such as intrusion prevention or zero trust network access, traffic analytics dashboards, and fully managed internet where the provider takes on carrier relationships entirely.
When reviewing an RFP response, ask the vendor to itemise each of these five inclusions explicitly rather than accepting a single bundled figure. A provider who can’t separate hardware refresh from support cost is usually hiding a shorter refresh cycle than you’d like.
What factors actually move your NaaS price?
Coverage and density set your baseline: mapping square footage to access point counts (roughly one AP per 1,500 to 2,500 sq ft for standard offices, denser in high-occupancy spaces) tells you whether a quote is realistic before you even discuss price.
Beyond that, five variables do most of the work:
- Number of sites: multi-site contracts often carry a per-site base fee, though volume discounts kick in past a certain site count.
- Service tier and SLA: a four-hour response guarantee costs meaningfully more than next-business-day support.
- Security scope: basic fire walling versus full zero trust architecture can shift pricing by a wide margin.
- Contract term: longer terms usually buy lower monthly rates in exchange for reduced flexibility.
- Refresh cycle and exit terms: a three-year refresh with unclear hardware ownership at exit can cost you more than a slightly higher monthly rate with clean transfer terms.
Pro Tip: Normalise every quote to a single monthly OpEx figure before comparing vendors. Strip out one-off installation charges, divide any annual figures by twelve, and add back anything quoted separately, such as ISP circuits, so you’re comparing like for like.
How do you build an apples-to-apples NaaS estimate?
Start by gathering five inputs: total square footage, access point density, headcount, device count, and your required SLA tier alongside contract length.
- Convert every quote to monthly figures. Annual contracts divide by twelve; day-rate public sector quotes need adjusting for the fact that enterprise buyers rarely pay daily rates for ongoing service.
- Translate between billing models. If one vendor quotes per square foot and another per user, use your own occupancy density to convert both into a per-site monthly total.
- Check for double-counted ISP costs. Some quotes bundle circuit costs; others list them as a pass-through extra, and mixing the two produces a false comparison.
- Confirm licence tiers match. A cheaper quote often reflects a lower licence tier with fewer security features, not genuinely lower unit pricing.
- Align refresh assumptions. A three-year refresh cycle costs differently from a five-year one, even at identical monthly headline rates.
Watch particularly for unrecognised one-off charges buried in appendices. They rarely show up in the headline monthly figure but materially change your first-year total.
What procurement checks should you run before signing?
Five checks separate a defensible NaaS decision from an expensive mistake:
- Scope clarity: confirm exactly which sites, users, and devices the quote covers, in writing.
- SLA definition: response times, resolution targets, and penalty clauses should be explicit, not implied.
- Hardware lifecycle and refresh: know when equipment gets replaced and who owns it at contract end.
- Exit and transfer terms: understand what happens to hardware, data, and configuration if you switch providers.
- Total cost of ownership: include your own internal labour for managing the vendor relationship, not just the invoice total.
Re-Solution structures proposals around a site survey first, so pricing reflects your actual building and device density rather than a generic estimate. Bands then separate core connectivity from optional add-ons such as advanced security or managed internet, which keeps the base quote comparable across vendors.
Organisations often receive different quote structures for identical scope. Normalising every proposal to a single monthly OpEx figure is the most useful step procurement teams can take before signing anything, according to TeleGeography’s market analysis.
Re-Solution’s NaaS service pages set out how this survey-first approach translates into scoped, comparable proposals for UK organisations.
Where procurement teams get NaaS pricing wrong
Vendors love quoting a low per-user headline because it looks competitive against a spreadsheet of alternatives. Ask immediately for the device and access point counts behind that figure, and for the licence tier it assumes, because the sticker price often hides a stripped-down security posture.
Three levers matter most in negotiation: contract term (longer usually buys a lower rate), bundling (combining NaaS with managed support or SD-WAN often beats buying separately), and pilot-to-scale concessions (providers frequently discount a rollout once you’ve proven the model on one site).
Subscription OpEx doesn’t automatically beat CapEx. It raises total cost when your refresh cycle is short and your estate is stable; it lowers it when growth is unpredictable and hardware would otherwise sit idle.
— Jacob
Get an accurate NaaS estimate from Re-Solution
Vendor quotes for network as a service can vary by a factor of two or three for what looks like identical scope on paper, and the only way to close that gap is a proper site survey rather than a desk-based estimate. Re-Solution runs an initial scoping call and wireless site survey before any figure gets attached to your project, so the quote reflects your building, device density, and support needs rather than a generic per-user template.
As a Cisco partner, some providers have experience pricing NaaS deployments across sites ranging from single offices to multi-building estates. Sector experience can matter when comparing quotes, because a provider unfamiliar with certain environments may underestimate access point density.
Start with a Network as a Service scoping call, and expect a clear breakdown of what’s included in the base price versus what sits in optional add-ons before you commit to anything.
Where to check NaaS pricing data yourself
For UK public sector day rates, check the Digital Marketplace listing. For global port and connectivity benchmarks, use TeleGeography’s pricing data. For UK procurement practice, see Re-Solution’s NaaS pages.
Sources
FAQ
What does NaaS stand for?
NaaS stands for Network as a Service, a subscription model where an organisation pays a recurring fee for network infrastructure, hardware refresh, and support rather than purchasing equipment outright.
What is meant by NaaS in practical terms?
It means shifting network spending from a capital expense to an operating expense, with the provider handling hardware lifecycle, licensing, and monitoring for a predictable monthly fee.
What are some examples of Network as a Service?
Examples include managed wireless coverage billed per access point, SD-WAN connectivity billed per site, and fully managed campus networking billed per user, such as the packaged offerings Re-Solution provides for education and manufacturing clients.
Which NaaS pricing model should I use for budgeting first?
Start budgeting with per user if headcount drives network need, per square foot for multi-site coverage, and per device or port when equipment count is fixed.
Do NaaS quotes usually include hardware refresh?
Most enterprise NaaS subscriptions include hardware refresh within the monthly fee, though the refresh cycle length varies by provider and should always be confirmed in writing before signing.
Recommended
- UK SD‑WAN Pricing: Componentised Budgets for 3, 25, 100 Sites
- 5 procurement checks IT leaders need for outsourced network management