For UK IT teams, the most effective approach to monitoring SaaS is to combine external, user-centric checks with a managed operations layer that covers telemetry ingestion, alerting, and incident response. If your organisation runs Microsoft 365, Google Workspace, Slack, Zoom, or Salesforce at scale, you need visibility beyond what vendor status pages provide.
Three immediate steps to take now:
- Run a SaaS asset audit. Identify every SaaS application in use, its user count, business criticality, and whether it falls under UK GDPR or sector-specific regulation.
- Check your current alert coverage. Confirm whether you have synthetic checks, real user monitoring (RUM), or log ingestion in place for your top five applications. If not, those gaps are your first priority.
- Decide on the managed versus self-managed question early. If your team lacks dedicated observability engineering capacity, a managed pilot with Re-solution is a lower-risk starting point than assembling a self-managed stack from scratch.
Pro Tip: Before committing to any tooling, map your SaaS estate against business criticality and regulatory exposure. Applications that handle personal data or underpin revenue-generating processes should be monitored first, regardless of vendor.
Key takeaways
Effective SaaS monitoring requires external user-centric checks, a structured alerting pipeline, and clear SLO ownership across IT operations and application teams.
| Point | Details |
|---|---|
| Start with a SaaS asset audit | Catalogue every application by user count, criticality, and UK GDPR exposure before selecting tools. |
| Use percentile latency, not averages | P95 and P99 latency targets reveal tail-latency issues that average response times conceal. |
| Combine synthetics with RUM | Synthetic checks catch regressions early; RUM confirms real user impact and makes SLOs actionable. |
| Address UK GDPR at design stage | Apply data minimisation, retention limits, and role-based access before deploying log ingestion. |
| Re-solution for managed monitoring | Re-solution delivers structured SaaS monitoring pilots with baseline SLOs and ITSM integration for UK organisations. |
Table of Contents
- What is SaaS monitoring and why does it matter for UK IT teams?
- What does a SaaS monitoring pipeline look like in practice?
- Which metrics and SLOs should you track?
- Which apps should you prioritise in a typical UK estate?
- How should you handle alerting, incident response, and AIOps?
- How do you meet UK GDPR and ICO requirements in your monitoring design?
- How do you implement SaaS monitoring? A phased plan with timelines
- Self-managed tooling versus a managed service: which is right for you?
- Re-solution’s approach and what it delivers for UK organisations
- The case for treating SaaS monitoring as infrastructure, not an afterthought
- Work with Re-solution on a SaaS monitoring pilot
- Sources
What is SaaS monitoring and why does it matter for UK IT teams?
SaaS monitoring is the practice of tracking, analysing, and managing the performance, availability, and utilisation of software-as-a-service applications. Unlike traditional infrastructure monitoring, which focuses on servers, switches, and on-premises workloads you control, SaaS monitoring operates under a shared responsibility model: the vendor manages the underlying infrastructure, but your organisation is responsible for the user experience, licence consumption, and compliance posture at your end.
That distinction matters operationally. A vendor’s status page may show all systems green while your users in Manchester experience degraded Microsoft 365 performance because of a regional ISP issue or a CDN routing anomaly. External, user-centric checks are the only way to detect that class of failure.
The business case for SaaS performance monitoring covers four areas:
- Performance and user experience. Degraded SaaS performance reduces productivity directly. Latency spikes in collaboration tools or CRM platforms affect every user simultaneously, unlike a single server failure.
- Cost control. Licence and usage analytics surface shelfware, over-provisioned tiers, and redundant subscriptions. Many UK organisations pay for significantly more SaaS capacity than they consume.
- Security and vendor accountability. Monitoring authentication logs, failed login patterns, and API access anomalies provides early warning of credential compromise or misconfigured integrations.
- UK GDPR and compliance. Telemetry from SaaS platforms can confirm whether data residency commitments are met and provide the audit trails that the ICO expects organisations to maintain. Service Level Objectives (SLOs) agreed with vendors need independent verification, not just vendor-reported uptime.
What does a SaaS monitoring pipeline look like in practice?
A well-structured SaaS monitoring pipeline moves data from collection through to actionable alerts in five stages. Understanding each stage helps teams assign tool responsibilities and avoid coverage gaps.
- Data collection. Sources include vendor APIs (Microsoft Graph API, Google Admin SDK, Salesforce Event Monitoring), SSO and identity provider logs, endpoint agents, and vendor status feeds. Each source provides a different layer of visibility.
- Asset discovery. Automated discovery via SSO/IdP integrations or cloud access security broker (CASB) tools identifies sanctioned and shadow SaaS applications. Without this, monitoring coverage is incomplete by definition.
- Synthetic checks and RUM. Scripted synthetic checks simulate critical user flows (login, file access, API calls) from multiple geographic locations, validating functionality even when no real users are active. Real user monitoring captures actual session data from browsers and endpoints. Combining both closes visibility gaps: synthetics catch regressions before users notice, while RUM shows the real-world impact on your workforce.
- Log and trace ingestion. Centralised log management aggregates authentication events, API call traces, and error logs from across the SaaS estate. This is where security and performance signals converge.
- Correlation, alerting, and dashboarding. Ingested data is correlated across sources to distinguish a vendor-side outage from a local network issue. Alerts route to on-call teams; dashboards give operations and management a shared view.
SaaS applications depend on external delivery chains — DNS resolution, ISP routing, CDN performance, and BGP path selection — that sit entirely outside your network perimeter. Traditional on-premises monitoring cannot see these paths, which is why external vantage points and internet-aware agents are a prerequisite, not an optional enhancement. For more context on where SaaS monitoring fits within a broader stack, the Re-solution guide to types of IT monitoring systems covers the full landscape.
Endpoint agents — available for deployment via standard enterprise tooling or mobile device management — extend telemetry to the device level. This matters for RUM instrumentation, where browser diversity across a typical UK enterprise estate (including Microsoft Edge, Chrome, and Firefox) produces measurably different performance profiles.
Pro Tip: Place synthetic check agents in the same geographic regions as your largest user populations. A check running from a London data centre will not reflect the experience of users in Edinburgh or Belfast connecting over a regional ISP.
Which metrics and SLOs should you track?
Uptime alone is an insufficient measure of SaaS health. Percentile-based latency targets and multi-region checks give a far more accurate picture of user experience than average response times, which mask tail-latency issues affecting a significant minority of requests.
| Metric | What it measures | Sample SLO / alert threshold |
|---|---|---|
| Availability | Service reachability from external check locations | 99.9% monthly uptime |
| P95 latency | 95th percentile response time for key transactions | “Under 1 second for web app load” |
| P99 latency | Tail latency affecting the slowest 1% of requests | “Under 2 seconds” |
| Error rate | HTTP 4xx/5xx responses as a percentage of total requests | < 0.5% over a 5-minute window |
| Auth latency | Time to complete SSO/SAML authentication flow | “Under 2 seconds” |
| API failure rate | Failed downstream API calls to vendor endpoints | < 1% per integration |
| Licence utilisation | Active users as a percentage of provisioned licences | Alert at < 70% or > 95% |
| Login anomalies | Failed authentication attempts, unusual geolocations | Alert on > 10 failures in 5 minutes |
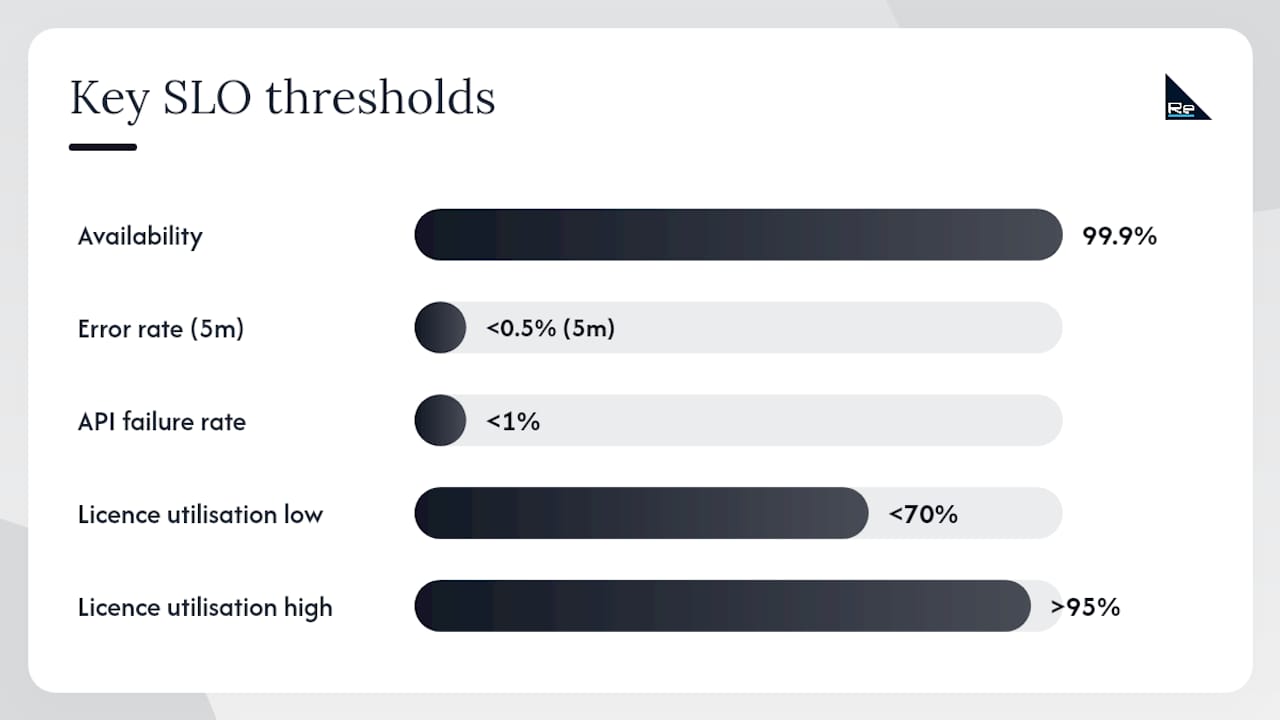
A few points on threshold selection. P95 latency is the right starting point for most SaaS SLOs because it captures the experience of the majority of users without being distorted by occasional outliers. P99 is worth tracking separately for latency-sensitive workflows such as real-time collaboration or financial transaction processing. Averages should be retired from SLO definitions entirely.
Licence and usage metrics deserve equal attention alongside performance data. Monitoring active user counts against provisioned licences across Microsoft 365, Salesforce, and similar platforms frequently reveals 15–30% of licences sitting unused. That is a direct cost reduction opportunity, not a secondary concern.
Instrumenting RUM across the browsers your workforce actually uses — including Microsoft Edge, which is the default browser in most Windows enterprise environments — ensures that performance data reflects real conditions rather than a synthetic baseline.
Which apps should you prioritise in a typical UK estate?
Most UK organisations share a common SaaS core. Pre-built integrations for Microsoft 365, Google Workspace, Slack, Zoom, and Salesforce are available across commercial monitoring platforms, making these the natural starting point for any monitoring programme.
Microsoft 365
Collect telemetry via the Microsoft Graph API and Microsoft 365 Service Health API. Key signals include Exchange Online mail flow latency, SharePoint and OneDrive availability, Teams call quality metrics (packet loss, jitter, round-trip time), and Azure AD authentication events. Microsoft 365 is typically the highest-criticality application in a UK enterprise estate and should be the first integration deployed.
Google Workspace
Use the Admin SDK Reports API to collect login activity, Drive access patterns, and service availability data. For organisations running hybrid estates with both Microsoft 365 and Google Workspace, cross-platform authentication monitoring is particularly important for detecting credential-related anomalies.
Slack
Monitor via the Slack Audit Logs API for security-relevant events (channel creation, file sharing, external workspace connections) and the Slack Status API for service availability. Slack’s real-time nature means that even brief outages have an immediate and visible productivity impact.
Zoom
Zoom’s Dashboard API provides meeting quality metrics including audio/video packet loss, latency, and jitter at the participant level. For organisations where video conferencing underpins client-facing or regulated communications, these metrics should feed directly into SLO reporting.
Salesforce
Salesforce Event Monitoring provides detailed API call logs, login history, and report export activity. For UK organisations subject to FCA oversight or handling customer personal data, Salesforce telemetry is also a compliance data source, not just a performance one.
Prioritisation checklist for the first 30 days:
- Identify the three applications with the highest user count and business criticality.
- Confirm which applications process personal data under UK GDPR and prioritise those for log ingestion.
- Deploy synthetic checks for login flows on your top three applications from at least two UK-based check locations.
- Connect licence utilisation monitoring for any application with more than 50 provisioned seats.
- Establish baseline P95 latency figures before setting SLO thresholds.
How should you handle alerting, incident response, and AIOps?
Telemetry without a structured response process generates noise rather than value. A clear escalation flow converts monitoring signals into resolved incidents.
- Alert fires. A synthetic check or threshold breach triggers an alert in your monitoring platform, routed to the on-call engineer via PagerDuty, OpsGenie, or your ITSM tool (ServiceNow, Jira Service Management).
- Triage. The on-call engineer checks correlated signals: is the issue isolated to one user group, one region, or one application? Is the vendor status page showing a known incident? This step determines severity.
- Escalation. If the issue cannot be resolved within a defined triage window (typically 15–30 minutes for P1 incidents), it escalates to a senior engineer or vendor support. Pre-agreed runbooks reduce decision time at this stage.
- Remediation. Actions range from failover to a backup service, user communication, or vendor escalation. For SaaS-specific incidents, remediation often means coordinating with the vendor rather than applying a local fix.
- Post-incident review. Document the timeline, root cause, and any SLO breach. Feed findings back into threshold tuning and runbook updates.
Alert fatigue is the most common failure mode in SaaS monitoring programmes. Poorly calibrated thresholds generate hundreds of low-signal alerts that on-call teams learn to ignore. Suppression rules, severity tiering (P1 through P4), and maintenance windows are essential controls, not optional refinements.
AIOps capabilities address this directly. Automated correlation groups related alerts from multiple sources into a single incident, reducing the volume of notifications an engineer receives during a complex failure. Anomaly detection identifies deviations from learned baselines without requiring manual threshold configuration for every metric. Root-cause suggestion engines, available in platforms such as Dynatrace and Moogsoft, surface probable causes ranked by confidence, shortening mean time to resolution (MTTR) materially. Internet-stack correlation — mapping a performance degradation to a specific BGP route change or CDN node failure — is particularly valuable for SaaS incidents where the root cause lies outside your network boundary.
How do you meet UK GDPR and ICO requirements in your monitoring design?
SaaS monitoring telemetry frequently contains personal data: usernames, IP addresses, authentication timestamps, and in some cases query strings or file names. UK GDPR applies to this data, and monitoring designs that ignore this create compliance exposure.
A practical checklist for UK teams:
- Establish a lawful basis. Legitimate interests is the most common basis for employee monitoring telemetry, but it requires a documented legitimate interests assessment (LIA). Confirm this with your legal or compliance team before deploying log ingestion.
- Apply data minimisation. Collect only the telemetry fields you will actually use for monitoring purposes. Strip or pseudonymise fields containing personal data (full names, email addresses in log strings) at the point of ingestion where possible.
- Set retention limits. Define and enforce retention periods for monitoring data. Performance metrics may warrant 90-day retention; security logs may require longer retention under your incident response policy, but this should be documented and justified.
- Encrypt in transit and at rest. All telemetry pipelines should use TLS 1.2 or higher. Monitoring data stores should be encrypted at rest with access-controlled key management.
- Implement role-based access. Dashboards and log access should be restricted by role. Operations engineers need different access levels from security analysts and senior management.
- Maintain audit trails. Log access to monitoring data itself. The ICO expects organisations to demonstrate that personal data in monitoring systems is accessed only for stated purposes.
- Review vendor data processing agreements. Confirm that your monitoring platform vendor’s DPA covers UK GDPR requirements, including data residency commitments if your organisation requires UK or EEA data storage.
For organisations in regulated sectors — financial services, healthcare, education — the ICO’s guidance on employee monitoring and the sector-specific guidance from bodies such as the FCA should be reviewed alongside the general UK GDPR framework. Cloud security controls and data governance are closely linked to monitoring design; a monitoring programme that lacks proper access controls can itself become a security risk. For a broader compliance framework, the Re-solution cybersecurity compliance guide covers the regulatory checkpoints most relevant to UK IT teams.
Pro Tip: Involve your Data Protection Officer or legal team at the design stage, not after deployment. Retrofitting data minimisation and access controls into a live monitoring pipeline is significantly more disruptive than building them in from the start.
How do you implement SaaS monitoring? A phased plan with timelines
A phased approach reduces risk and delivers early value before committing to full-scale deployment.
- Discovery (weeks 1–2). Audit the SaaS estate: catalogue applications, user counts, business criticality, and regulatory exposure. Review existing monitoring coverage and identify gaps. Define initial SLO targets in collaboration with application owners.
- Pilot (weeks 3–6). Deploy synthetic checks and basic API telemetry for the top three applications. Establish baseline performance data. Configure initial alert thresholds and route alerts to the on-call team. Validate data minimisation and access controls against UK GDPR requirements.
- Rollout (weeks 7–12). Extend coverage to the full priority application list. Integrate with ITSM tooling (ServiceNow, Jira Service Management). Deploy RUM instrumentation where applicable. Refine alert thresholds based on pilot data.
- Optimise (ongoing, from month 4). Review SLO attainment monthly. Tune thresholds based on operational feedback. Add new application integrations as the SaaS estate evolves. Conduct quarterly reviews of licence utilisation data.
Cost drivers to plan for:
- Agent and synthetic check licensing (typically per-check or per-location pricing).
- RUM instrumentation (often per-session or per-page-view pricing).
- Log ingestion and storage costs, which scale with data volume and retention period.
- Integration development time for applications without pre-built connectors.
- Staff time for ongoing threshold tuning, alert triage, and reporting, which is frequently underestimated.
For teams considering a managed engagement, the staff time component is the most significant variable. A managed service provider absorbs the engineering overhead of pipeline maintenance, threshold tuning, and 24/7 alert triage, converting a variable internal cost into a predictable managed fee. The Re-solution network audit service provides a structured starting point for organisations that want an independent assessment before committing to a monitoring architecture.
Roles and responsibilities checklist:
- Project sponsor (IT Director or CTO): scope approval, budget sign-off, SLO ownership.
- Technical lead: architecture design, tool selection, integration delivery.
- Security/compliance lead: UK GDPR review, DPA verification, access control design.
- Operations team: alert triage, runbook authorship, on-call scheduling.
- Application owners: SLO definition, escalation contacts, change notification.
Self-managed tooling versus a managed service: which is right for you?
The decision between running SaaS monitoring in-house and engaging a managed provider turns on four factors: internal skills availability, the scale and complexity of your SaaS estate, compliance requirements, and total cost of ownership.
| Dimension | Self-managed | Managed service |
|---|---|---|
| Upfront effort | High: tool selection, integration build, pipeline configuration | Lower: provider handles architecture and onboarding |
| Ongoing operational overhead | High: threshold tuning, alert triage, pipeline maintenance | Low: provider manages day-to-day operations |
| Skills requirement | Dedicated observability engineering capacity needed | Relies on provider expertise; internal team focuses on outcomes |
| Flexibility | Full control over tooling and data | Constrained by provider’s platform and integration catalogue |
| Cost structure | Variable: licensing plus staff time | Predictable: managed fee, often with defined SLAs |
| Compliance visibility | Team controls all data handling decisions | Requires careful DPA and data residency review with provider |
| Time to value | “Longer deployment times measured in multiple weeks” | Faster: provider accelerates onboarding with pre-built integrations |
A self-managed approach suits organisations with an existing observability engineering team, a complex or highly customised SaaS estate, and the capacity to maintain the pipeline over time. Procurement decisions should weigh coverage and operational overhead carefully: a tool that covers many applications but requires significant engineering time can cost more in practice than a managed service.
What to expect from a credible managed SaaS monitoring provider:
- A documented onboarding process with defined milestones and a clear handover plan.
- Pre-built integrations for your priority applications, deployed and validated within the pilot period.
- Agreed SLOs for the monitoring service itself (alert response time, dashboard availability, reporting cadence).
- Regular reporting: weekly operational summaries and monthly SLO attainment reviews as a minimum.
- A clear escalation path for P1 incidents, with defined response time commitments.
- UK data residency options and a DPA that meets UK GDPR requirements.
Tool review resources can help build an initial shortlist, but they should always be paired with a hands-on pilot. Vendor marketing materials describe capabilities under ideal conditions; a pilot reveals real-world integration complexity and operational overhead.
Re-solution’s approach and what it delivers for UK organisations
Re-solution brings over 35 years of Cisco infrastructure and managed services experience to SaaS monitoring engagements. As a Cisco partner, Re-solution’s monitoring capability sits within a broader managed services framework that covers network infrastructure, NaaS, security, and compliance, giving clients a single operational view across their connectivity and application layers.
Service features relevant to SaaS monitoring:
- Managed monitoring covering SaaS application performance, availability, and licence utilisation.
- Integration with ITSM platforms for alert routing and incident management.
- Network-layer visibility via Cisco tooling, providing the internet-aware context needed to distinguish vendor-side failures from network delivery issues.
- Infrastructure audits that establish a baseline before monitoring deployment.
- Sector experience across education, manufacturing, logistics, hospitality, and shared workspaces, each with distinct SaaS estates and compliance profiles.
Anonymised outcome: UK manufacturing organisation
A UK-based manufacturer running Microsoft 365, Salesforce, and a sector-specific ERP application engaged Re-solution for a managed monitoring pilot. Within six weeks of onboarding:
Re-solution deployed synthetic checks and API telemetry for all three applications, established baseline SLOs, and integrated alerting with the client’s existing ServiceNow instance. MTTR for SaaS-related incidents reduced from an average of four hours to under 45 minutes. Licence utilisation monitoring identified 18% of Microsoft 365 licences as inactive, generating a direct cost reduction at the next renewal cycle. The client’s IT team moved from reactive incident response to proactive SLO management within the pilot period.
For teams ready to move forward, the logical next step is a discovery call or a structured network and monitoring audit to establish a baseline and define the scope of a pilot engagement.
The case for treating SaaS monitoring as infrastructure, not an afterthought
Most organisations treat SaaS monitoring as something to add once the SaaS estate is mature. That sequencing is backwards. The moment a SaaS application becomes business-critical — which for Microsoft 365 or Salesforce is typically day one of deployment — it needs the same operational rigour as any on-premises system.
The argument against investing in SaaS monitoring usually comes down to one of two positions: either “the vendor handles reliability” or “we don’t have the engineering capacity.” The first position misunderstands the shared responsibility model. The second is a genuine constraint, but it is an argument for a managed service, not for accepting blind spots.
What tends to get overlooked is the compliance dimension. UK GDPR requires organisations to demonstrate control over personal data processing, including the telemetry generated by SaaS applications. An organisation that cannot produce audit logs showing who accessed what data, when, and from where is not just operationally exposed — it is potentially non-compliant. Monitoring is not only a performance tool; it is part of the evidence base that demonstrates responsible data stewardship.
The teams that get the most value from SaaS monitoring are those that treat SLO attainment as a shared metric between IT operations and the business, not a purely technical concern. When application owners understand what a P95 latency target means for their users, and when finance teams can see licence utilisation data in plain terms, monitoring becomes a business conversation rather than an engineering one.
Work with Re-solution on a SaaS monitoring pilot
Re-solution’s managed IT services give UK organisations a faster, lower-risk path to SaaS monitoring than assembling a self-managed stack. Rather than spending months on tool selection, integration build, and threshold calibration, you get a structured pilot that delivers baseline SLOs, synthetic checks, and ITSM-integrated alerting within weeks, not quarters.
A pilot engagement with Re-solution includes a SaaS estate audit, deployment of synthetic checks for your priority applications, baseline SLO definition, alert routing to your existing ITSM platform, and a documented handover plan. Re-solution’s Cisco partnership and 35 years of managed services experience mean the network and application layers are monitored together, giving your team a single operational view. For organisations in education, manufacturing, logistics, or hospitality, Re-solution has direct sector experience with the SaaS estates and compliance profiles those industries carry.
To start, book a discovery call or request a monitoring audit and Re-solution will scope a pilot engagement matched to your estate and budget.
Sources
The sources below are grouped by primary use case to help you navigate to the most relevant material quickly.
For technical implementation:
- What’s SaaS Monitoring? Why You Need To Monitor SaaS Apps | Splunk
- SaaS monitoring best practices for performance, security, and user experience | Catchpoint
- SaaS monitoring: Metrics, tools, and best practices explained | UptimeRobot Knowledge Hub
- SaaS performance monitoring | ThousandEyes
- SaaS monitoring – LogicMonitor
- The 5 most popular SaaS monitoring tools for 2025 | Cledara
For procurement and tool selection:
For compliance and UK GDPR:
For internet-aware and network-layer visibility:
Recommended
- Infrastructure scaling step by step: a 2026 guide for UK IT teams
- Types of IT monitoring systems: a 2026 guide
- NOC networking explained for UK IT teams
- How to enhance network performance: 2026 IT guide