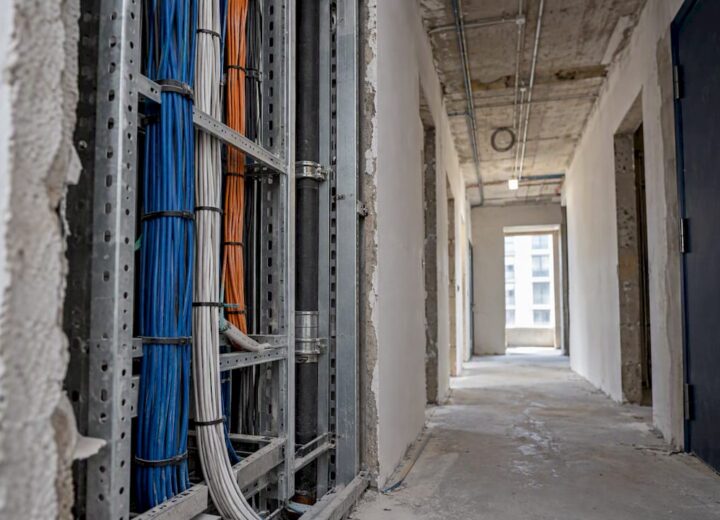
A predictive Wi-Fi survey models coverage, signal strength, and capacity across a building using floorplans and material data, before a single access point is installed. It exists to size and place hardware quickly and cheaply. The correct workflow pairs this modelling with a targeted on-site validation survey once deployment is complete, because predictive tools carry a residual error margin and cannot model every real-world variable. Used together, the two stages cut both cost and risk.
TL;DR:
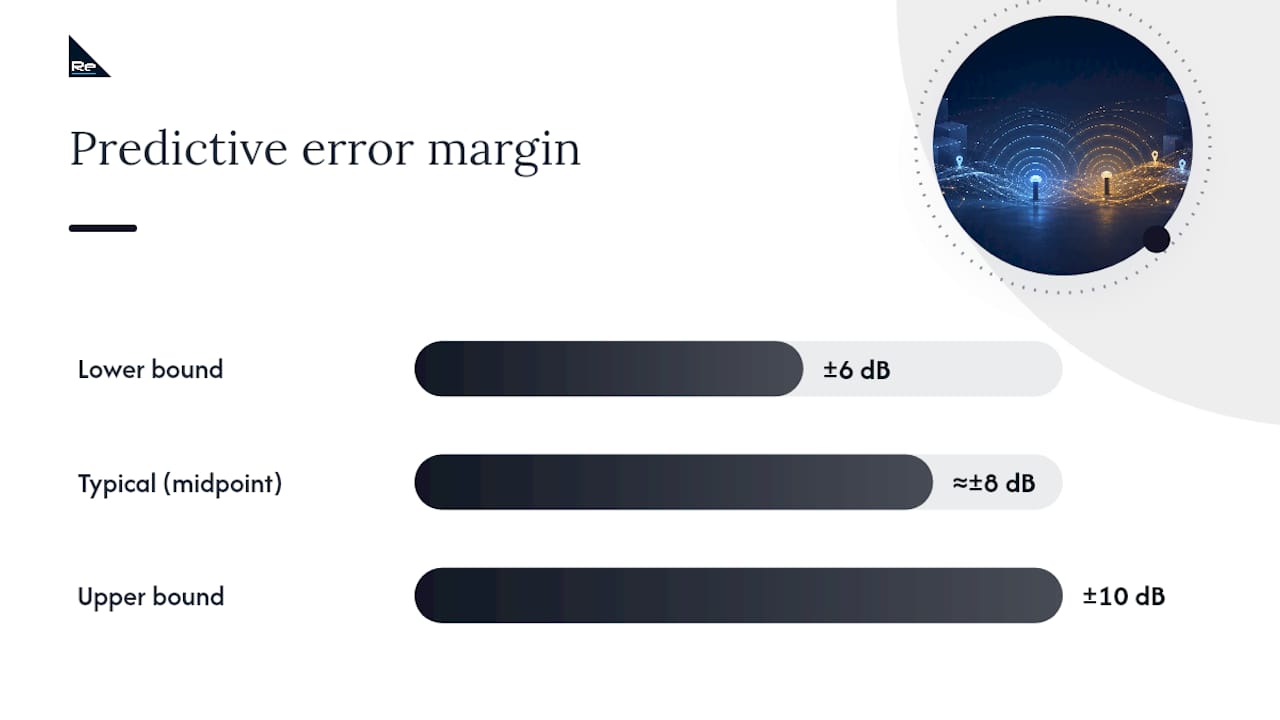
- Predictive Wi-Fi models carry a typical error margin of around ±6 to 10 dB, making validation essential for accurate real-world performance.
- Accurate modeling requires precise inputs such as CAD floorplans, detailed wall materials, specific AP and antenna models, and realistic device density estimates.
- A hybrid survey approach, combining predictive modeling with sample on-site validation, reduces risks and ensures performance targets are met before full deployment.
- Environmental factors like furniture, multipath reflections, and material variations can cause discrepancies that models cannot fully predict without physical measurements.
- Selecting between predictive-only, full on-site, or hybrid surveys depends on environment complexity, with hybrid being most suitable for mid-to-large projects.
Table of Contents
- What Is a Predictive Wi-Fi Survey and What Does It Model?
- Predictive vs On-Site vs Hybrid: Which Should You Choose?
- What Inputs Does an Accurate Predictive Model Need?
- A Step-by-Step Checklist for Running a Predictive Wi-Fi Survey
- How Do You Read Predictive Outputs and Avoid Common Mistakes?
- How Re-Solution Applies Predictive Surveys in the Field
- Why the Industry’s Comfort With Predictive-Only Designs Is a Mistake
- Get Your Predictive Wi-Fi Survey Right the First Time
- Sources
- FAQ
What Is a Predictive Wi-Fi Survey and What Does It Model?
A predictive Wi-Fi survey is a software simulation. You import a scaled floorplan, tell the modelling tool what each wall and floor is made of, place virtual access points, and the software calculates expected signal strength, noise, and throughput across every point in the building before any cabling or hardware goes in.
The physics behind it is multi-wall path-loss modelling. Radio signal weakens with distance and loses further strength passing through obstacles, with each material assigned an attenuation value. Commercial planning tools commonly use variations of the COST-231 multi-wall model to calculate this, applying a decibel penalty for brick, a smaller one for plasterboard, and a heavy one for reinforced concrete or lift shafts.
This works well as a planning tool because it lets you test AP counts, channel plans, and mounting positions on a screen rather than in a ceiling void. What it models reliably:
- Free-space and multi-wall path-loss based on distance and material
- Expected coverage contours for a given AP density and transmit power
- Rough capacity estimates based on assumed client counts per area
- Comparative differences between AP placement options
What it typically cannot model with confidence: furniture layout changes made after the survey, real-time people density, multipath reflection off metal shelving or machinery, and interference from neighbouring networks or non-Wi-Fi devices. Standards documentation from bodies such as IEEE covers the protocol behaviour predictive tools are built to respect, but no simulation captures a warehouse floor the way a spectrum analyser does on the day.
Predictive vs On-Site vs Hybrid: Which Should You Choose?
Choosing the right survey method is a procurement decision as much as a technical one, and getting it wrong wastes budget in both directions: over-specifying a full on-site survey for a simple office fit-out, or under-specifying validation for a warehouse with steel racking.
- Choose predictive-only for straightforward, low-risk environments: small offices, standard classrooms, retail units with light-gauge partition walls, and any site still under construction where physical access is impossible anyway.
- Choose a full on-site survey for environments with unusual RF behaviour: hospitals with lead-lined rooms, listed buildings with solid stone or metal-framed windows, and manufacturing floors with dense metal machinery that predictive tools cannot cost accurately.
- Choose a hybrid approach for most mid-to-large projects: run the predictive model to size the design, then validate with on-site measurements at a sample of critical points rather than a full manual walk of the entire site.
- Structure the hybrid stage properly. Ask the supplier to define acceptance criteria before deployment, not after, so validation has something concrete to check against.
- Use a decision checklist with suppliers, covering: is the floorplan finalised or will walls move before occupancy; does the site contain dense metal, water tanks, or lift shafts; is there a hard SLA for RSSI or throughput; and is post-deployment access to the site realistic within budget.
Logistics and warehousing sites sit firmly in hybrid or full-survey territory. A warehouse briefing checklist is worth working through with any supplier before scoping, since racking height and stock density change coverage far more than most predictive defaults assume.
What Inputs Does an Accurate Predictive Model Need?
Model quality is entirely dependent on input quality. A predictive Wi-Fi survey built on a rough sketch and guessed wall types will produce a heatmap that looks authoritative and means very little.
The inputs that actually matter:
- Scaled, dimensionally accurate floorplans, ideally CAD or an architect’s drawing rather than a photographed sketch
- Wall and floor material assignments for every partition, not just exterior walls, since internal fire doors and lift shafts carry heavy attenuation
- AP and antenna models, including manufacturer radiation patterns, since a generic omni-directional assumption will misrepresent a directional or high-gain antenna
- Device density and application demand per zone, such as how many concurrent devices a lecture hall or warehouse aisle needs to support, and what bandwidth those applications require
Get these four inputs wrong and the whole model drifts, regardless of how good the underlying software is.
Statistic callout: Predictive tools using COST-231-style multi-wall modelling typically carry a residual error margin of around ±6 to 10 dB in standard environments. That is enough to shift a location from comfortably “excellent” signal to marginal, which is precisely why validation exists.
Band choice compounds this. Signals at 2.4GHz travel further and penetrate walls more easily than 5GHz, and 6GHz (Wi-Fi 6E) attenuates fastest of all, meaning a model tuned for 5GHz coverage will overstate 6GHz reach unless material values are adjusted per band.
To raise model fidelity before committing to a design, use photo-verified floorplans rather than trusting drawings that may predate a refit, take a handful of spot RF measurements in the most doubtful zones, and build in a conservative margin rather than designing to the exact predicted threshold. Vendors such as Ekahau recommend pairing predictive software with calibrated measurement hardware specifically because it narrows this margin for projects with strict SLAs.
A Step-by-Step Checklist for Running a Predictive Wi-Fi Survey
A predictive survey run without structure produces a pretty heatmap and little else useful. Running it as a disciplined process, with defined inputs and defined outputs, is what turns it into a design you can actually build from.
- Collect pre-survey data. Request finalised floorplans, a materials schedule for every wall type, an inventory of existing network cabling and switch locations, and a device density estimate per zone from the client before opening any modelling software.
- Confirm capacity targets, not just coverage targets. Ask how many devices per classroom, warehouse bay, or hotel room the network must support, and what applications (video conferencing, RTLS tags, POS terminals) drive that demand.
- Model with sensible defaults, then stress-test them. Run the baseline design at typical transmit power and antenna orientation, then test channel plan alternatives and reduced power scenarios to see how much margin exists before coverage gaps appear.
- Demand a full deliverables pack, not just a picture. You should receive a coverage heatmap, an SNR overlay, capacity estimates by zone, proposed AP mounting points with height and orientation, the channel and power plan, and an assumptions log listing every material and device value used.
- Build the validation plan alongside the design, not after it. Define sample validation points in advance, including the hardest zones (lift lobbies, external walls, dense storage), set acceptance thresholds for RSSI, SNR, and throughput, and agree what triggers rework versus what counts as an acceptable pass.
Pro Tip: When validating, enable forced client roaming on test devices and save a heatmap snapshot before and after any channel or power change. Comparing snapshots side by side catches regressions that a single post-change reading would miss.
The network capacity planning guide is a useful reference for setting realistic device density figures before this process starts, since underestimating concurrent connections is one of the most common causes of a design that looks fine on paper and struggles at go-live.
How Do You Read Predictive Outputs and Avoid Common Mistakes?
A coverage heatmap tells you where signal reaches a given RSSI threshold, typically colour-coded from strong (often green or blue) through to unusable (red). But RSSI alone does not tell you whether a network will perform well. SNR, the ratio between signal and background noise, determines whether that signal is usable, and capacity overlays estimate how many devices a zone can serve at an acceptable data rate before contention degrades performance.
Read all three together against documented acceptance criteria, not RSSI in isolation, and a design that looks green everywhere can still fail a capacity test in a lecture theatre or open-plan office at peak occupancy.
Common pitfalls worth checking before sign-off:
- Wrong wall material costing. A generic “internal wall” attenuation value applied to a fire-rated door or lift shaft will understate loss significantly.
- Ignoring vertical effects. Multi-floor buildings need floor-to-floor attenuation modelled explicitly; a model that only checks horizontal spread will misjudge AP counts on the floor above and below.
- Ignoring multipath and reflection. Metal shelving, HVAC ductwork, and machinery reflect signal in ways flat wall-loss models do not capture, which is exactly why warehouse and manufacturing sites need physical validation.
- Treating shelving as static. Warehouse racking that changes height or stock density after the survey shifts real-world attenuation away from the predicted model.
Historic buildings with solid stone or lath-and-plaster walls, and mixed-use sites combining retail, office, and residential zones, both deserve extra validation points, since material assumptions that hold in one zone often fail in the next.
How Re-Solution Applies Predictive Surveys in the Field
Re-Solution runs predictive Wi-Fi surveys as the first stage of a two-stage workflow, never as the final word on a design. Predictive modelling sizes the access point count, capacity, and channel plan; a targeted on-site validation survey then confirms performance against documented RSSI, SNR, and throughput thresholds before sign-off.
This process is applied across education, manufacturing, logistics, hospitality, and shared workspace environments, where the right balance of predictive speed and validation rigour changes by sector.
Practical outcomes clients see from this approach:
- Faster initial design turnaround than a full manual site walk, particularly useful during construction phases when physical access is limited
- Fewer post-installation surprises because acceptance thresholds are agreed before deployment, not negotiated after
- A documented assumptions log that makes it possible to re-run the model quickly if floorplans or occupancy targets change
Further detail on why validation matters alongside predictive design sits in Re-Solution’s wireless site survey guidance.
Why the Industry’s Comfort With Predictive-Only Designs Is a Mistake
The conventional pitch around predictive Wi-Fi surveys treats them as a complete answer: run the software, get a heatmap, install the APs where it says. That framing undersells the ±6 to 10 dB error margin baked into every multi-wall model, and it is precisely how underperforming networks get signed off on paper before anyone notices the lecture hall drops connections at capacity.
The judgement worth taking from this: predictive modelling is genuinely good at what it does, sizing AP counts, testing channel plans, and catching gross design errors cheaply, before cabling goes in. It is not good at telling you what a warehouse floor will do once racking fills up, or how a lift shaft behaves at 6GHz. Treating the two stages as one exercise, rather than a sequence with a validation checkpoint in between, is where most underperforming rollouts start.
What should come first for any IT manager scoping this work: agree the acceptance thresholds and the validation sample points before the predictive model is even finished, not after. That single change in sequencing does more to protect a rollout than any improvement in modelling software.
— Jacob
Get Your Predictive Wi-Fi Survey Right the First Time
Re-Solution runs predictive Wi-Fi surveys as part of network survey and infrastructure audit engagements, then follows them with the on-site validation that turns a modelled design into a network you can actually rely on. Where competing predictive-only tools stop at a heatmap, this process carries through to documented RSSI, SNR, and throughput sign-off.

Before booking a scoping call, gather your floorplans (scaled, ideally CAD), a rough materials list for internal partitions, and your device density expectations per zone. That handful of inputs alone will speed up the first conversation considerably. If ongoing management after deployment is also on your radar, Re-Solution’s Network as a Service options cover monitoring and support once the network is live. Ready to scope your survey? Get in touch with Re-Solution to start the conversation, or read more on understanding cloud networking if your rollout includes a cloud-managed component.
Sources
For standards background, the IEEE overview of Wi-Fi’s evolution explains the protocol basis predictive tools model against. For modelling tool comparisons, see Ekahau, NetSpot, and Hamina Planner. For a practical consumer-facing walkthrough of validating predictive results against real measurements, see this Wi-Fi installation guide.
- IEEE – The evolution of Wi‑Fi technology and standards
- WiFi Heatmap — browser Wi‑Fi planner (explainer on COST‑231 multi‑wall modelling)
- Ekahau – Wi‑Fi design, optimisation and survey tools
FAQ
What Is a Predictive Wi-Fi Survey?
It is a software simulation that models expected Wi-Fi coverage, signal strength, and capacity across a floorplan using material attenuation values and AP placement, run before any hardware is installed.
How Accurate Is a Predictive Wi-Fi Survey?
Standard multi-wall models typically carry a residual error margin of around ±6 to 10 dB, which is why a targeted on-site validation survey is recommended after deployment.
Do I Still Need an On-Site Survey After Predictive Modelling?
Yes, for most mid-to-large or complex projects. A hybrid approach, predictive design followed by validation at sample points, catches issues like multipath and material misclassification that modelling alone cannot.
What Inputs Does a Predictive Wi-Fi Survey Need?
Scaled floorplans, accurate wall and floor material assignments, specific AP and antenna models, and realistic device density and application demand per zone.
Can Re-Solution Run Both the Predictive and Validation Stages?
Yes. Re-Solution structures network surveys as a two-stage workflow, predictive design followed by on-site validation against documented RSSI, SNR, and throughput thresholds, as part of its network survey and infrastructure audit services.
Recommended
- Optimise Wi-Fi bandwidth: A practical management guide
- Why Invest in a Wireless Site Survey?
- Network improvement strategies list: 2026 guide for IT teams
- How to manage workspace bandwidth: IT manager’s guide