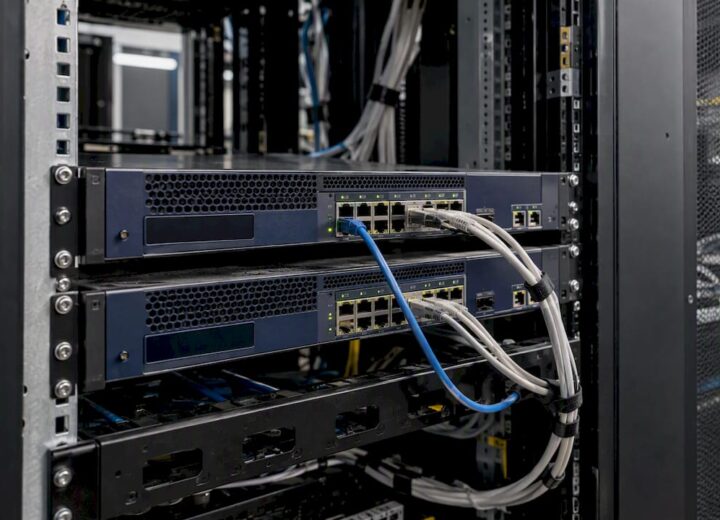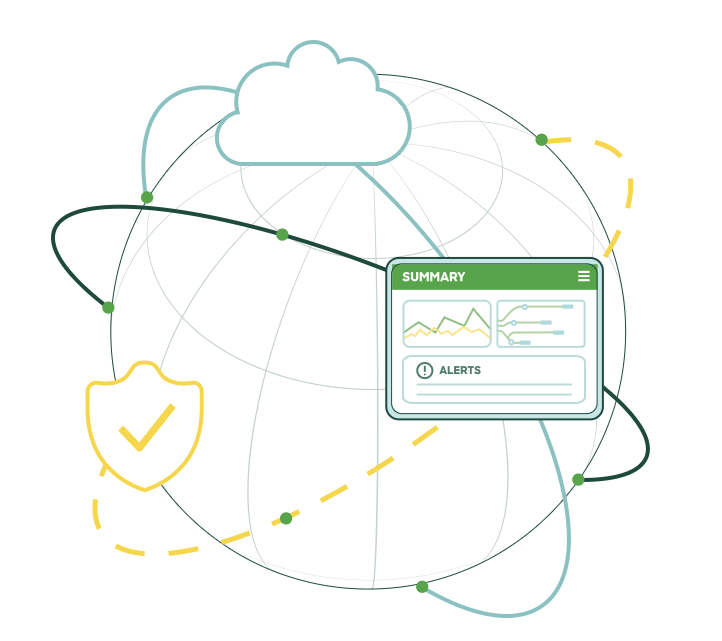
Network SLA monitoring is continuous, endpoint-level measurement of your service level indicators, paired with automated alerting that fires before a contractual breach happens. Start by instrumenting synthetic checks and endpoint telemetry against defined SLIs and SLOs, then set warning alerts at about half of your allowed degradation budget. Anchoring this on established SLI/SLO discipline and telemetry frameworks such as OpenTelemetry turns SLA management from a monthly scramble into a routine operational task.
TL;DR:
- Combining synthetic checks, passive telemetry, and device probes ensures comprehensive SLA measurement and reduces blind spots.
- Setting warning alerts at around half the degradation budget allows proactive response before an SLA breach occurs.
- Automating data collection and calculation with OpenTelemetry and recording rules minimizes manual errors and supports multi-tenant environments.
- An initial network audit helps identify coverage gaps and builds confidence that SLAs are accurately monitored before automation.
- Treating SLA monitoring as an operational discipline with strict SLOs, early warning thresholds, and continuous pipelines is crucial for compliance success.
Table of Contents
- SLIs, SLOs and SLAs: making the measurement model match the contract
- Which network metrics actually belong in an SLA calculation?
- Synthetic checks, passive telemetry and device probes: choosing the right method
- Setting alerts before you breach: the 50% burn-rate rule.
- Automating the pipeline: OpenTelemetry, recording rules and multi-tenant SLAs
- Reporting versus real-time compliance: what stakeholders actually need to see
- How Re-solution turns this framework into a working monitoring programme
- Why most SLA monitoring programmes fail on discipline, not tooling
- Get a network audit that turns this guide into a working dashboard
- Sources
- FAQ
SLIs, SLOs and SLAs: making the measurement model match the contract
An SLA is the legal promise. An SLO is the internal target you set to protect that promise. An SLI is the raw measurement feeding both. Get the distinction wrong and you’ll either alert too late or chase noise that never threatens the contract.
Three examples make this concrete:
- Availability SLI: percentage of successful synthetic checks against a WAN edge device over a rolling month.
- Latency SLI: p99 round-trip time between branch and data centre, measured every 60 seconds.
- Packet loss SLI: percentage of ICMP or UDP probes dropped across a monitored path.
The rule that separates functioning SLA programmes from paper ones: SLOs should always be stricter than the SLA. If your contract promises 99.9% monthly availability, set an internal SLO of 99.95%. That gap is your working buffer. If your SLA states “average latency under 80ms,” your SLI should track p99, not the mean, because a mean can hide the exact spikes that make users complain.
Which network metrics actually belong in an SLA calculation?
Most SLA disputes come down to measurement definitions, not actual performance. Six metrics cover nearly every clause you’ll encounter in a network services contract:
- Availability: a 99.9% monthly target allows roughly 43 minutes of downtime; 99.99% allows around 4 minutes.
- Latency: report p95 for general capacity planning, but use p99 for anything customer-facing, since it exposes tail-end spikes the average conceals.
- Packet loss and jitter: critical for voice and video; feed both into a Mean Opinion Score (MOS) calculation if VoIP quality is contractually specified.
- Throughput and bandwidth utilisation: relevant wherever a contract guarantees minimum data rates.
- MTTR and incident counts: these often carry as much contractual weight as uptime percentages, particularly in managed service agreements.
Statistic to remember: a 99.9% SLA leaves you with an error budget of about 43 minutes a month. Burn through a third of that in a single incident, and you’re already in warning territory for the rest of the period. Combining ICMP, SNMP, flow telemetry and QoS probes, as Paessler’s PRTG documentation recommends, avoids the instrumentation gaps that turn a genuine SLI into guesswork.
Synthetic checks, passive telemetry and device probes: choosing the right method
No single monitoring technique gives you a complete SLI. Combine methods deliberately rather than defaulting to whichever tool is already installed.
- Synthetic monitoring runs scripted checks (HTTP, DNS, TCP handshake, full transaction paths) at fixed intervals, typically every 30 to 60 seconds for critical endpoints, to measure what a real user would experience even when traffic is quiet.
- Passive telemetry, increasingly captured through OpenTelemetry instrumentation, records real transaction data as it flows through the network, giving you volume and accuracy synthetic checks can’t match alone.
- Device-side and protocol probes, including ICMP, UDP jitter tests, and IP SLA/NQA-style measurements, sit closest to the wire and are ideal for path-level diagnostics between specific network nodes.
- Federated path testing, of the kind perfSONAR performs across institutional networks, suits organisations that need end-to-end visibility across multiple administrative domains rather than a single site.
The trade-offs are real: synthetic checks add polling overhead and can generate false positives during transient blips; passive telemetry needs proper instrumentation coverage or it leaves blind spots; device probes require ongoing maintenance as topology changes. Most mature SLA programmes run all three in parallel and reconcile the data.
Setting alerts before you breach: the 50% burn-rate rule.
Waiting until an SLA is broken to raise an alarm is not monitoring, it’s a post-mortem. The operational fix is a two-tier alert structure built around your degradation budget, the amount of downtime or latency slippage your SLA tolerates before penalties apply.
- Warning alert: trigger at 50% of the degradation budget consumed, giving your team time to remediate calmly rather than in a scramble.
- Critical alert: trigger as you approach the full budget, when escalation and customer communication become unavoidable.
- Burn rate: calculated as (downtime so far ÷ time elapsed in the period) divided by (total budget ÷ total period length); a burn rate above 1.0 means you’re consuming budget faster than the period allows.
Setting warnings at roughly half the allowed degradation budget is now a widely recommended baseline, precisely because it converts a binary pass/fail metric into an early signal you can act on.
Pro Tip: Wire your warning alerts into the same runbook that handles maintenance windows. A network change that overruns its scheduled window is one of the most common causes of an avoidable SLA breach.
Automating the pipeline: OpenTelemetry, recording rules and multi-tenant SLAs
Manual SLA spreadsheets fall apart once you’re tracking more than a handful of endpoints or customers. The fix is a proper measurement pipeline, not a bigger spreadsheet.
- Collectors gather raw telemetry from synthetic checks, device probes and application traces.
- Metric stores retain that data long enough to support monthly, quarterly and annual reporting cycles.
- Recording rules, in the Prometheus tradition, pre-calculate SLI values on a schedule rather than recomputing them ad hoc.
- Reporting scripts turn stored SLIs into the availability percentages and credit calculations your contracts require.
Automating this pipeline with OpenTelemetry removes the manual calculation errors that creep in when engineers are hand-editing figures under deadline pressure. For organisations serving multiple customers, tag telemetry by tenant at the collection stage rather than running separate monitoring stacks per client, and keep a clear audit trail so every compliance figure can be reproduced months later if a customer disputes it.
Reporting versus real-time compliance: what stakeholders actually need to see
Reporting and compliance monitoring answer different questions, and conflating them is a common design mistake. Reporting looks backward; compliance monitoring looks forward, at the risk of breaching before the period closes. You need both running simultaneously.
A concise SLA report should cover:
- Monthly availability percentage against the contracted target
- Incident count, MTTR and root cause summary
- Maintenance windows excluded from the calculation, and why
- Any service credits triggered
Daily dashboards, by contrast, should surface burn rate and operational indicators, per-customer compliance status, and trending p99 latency, the leading indicators that let you act before the report is even written. A public status page with clear maintenance announcements closes the loop, since customers who see planned work in advance rarely dispute the exclusion later.
How Re-solution turns this framework into a working monitoring programme
Re-solution has operated as a Cisco partner for more than 35 years, and the audit-first approach it applies to client networks maps directly onto the SLI/SLO groundwork above. A structured network audit typically measures current availability, latency distribution, and existing device coverage, then flags the gaps, unmonitored links, missing redundancy, undocumented change windows, that undermine SLA confidence before contracts are even signed.
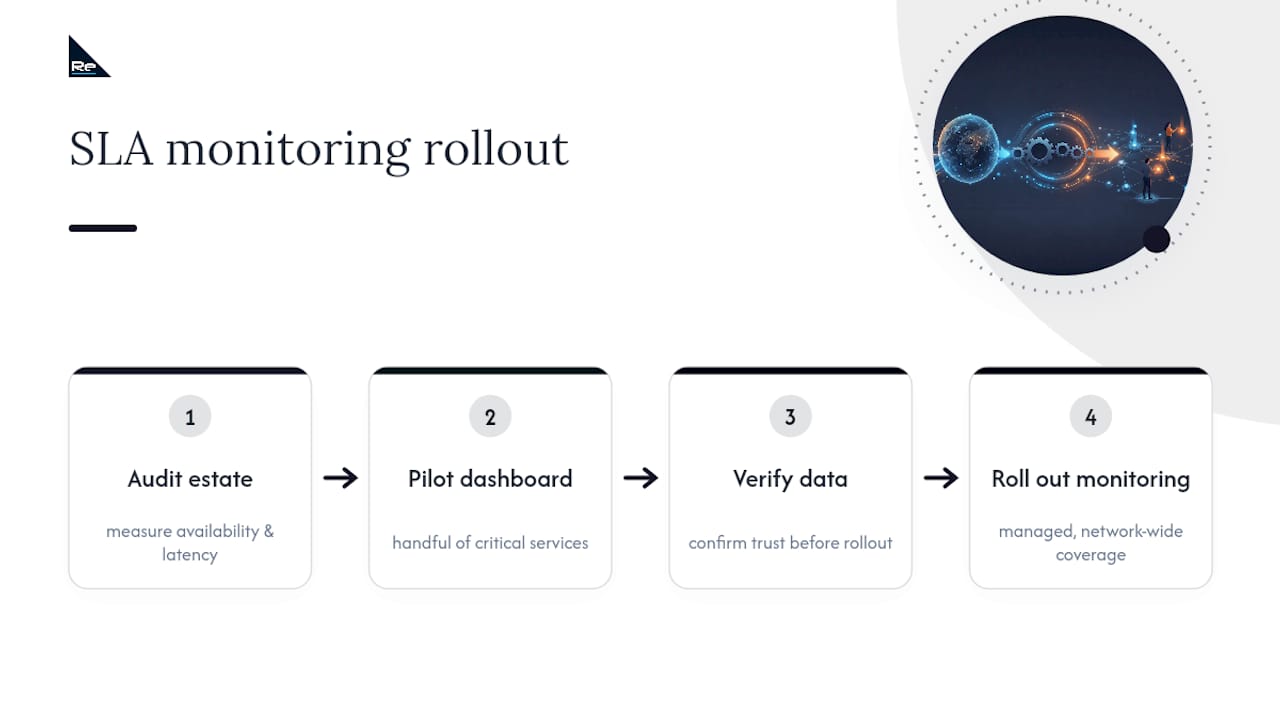
The practical sequence Re-solution recommends is straightforward: audit the existing estate, pilot a live SLA dashboard against a handful of critical services, then roll out managed monitoring across the wider network once the pilot proves the numbers hold up. It’s a route that avoids committing to full-scale automated SLA management before you’ve verified the data underneath it is trustworthy.
Why most SLA monitoring programmes fail on discipline, not tooling
Every organisation that has struggled with SLA compliance has decent monitoring tools installed somewhere. The failure almost never comes from lacking a dashboard. It comes from treating SLA monitoring as a reporting chore rather than an operational discipline with its own rules: strict SLOs, early warning thresholds, and pipelines that don’t rely on someone remembering to run a script.
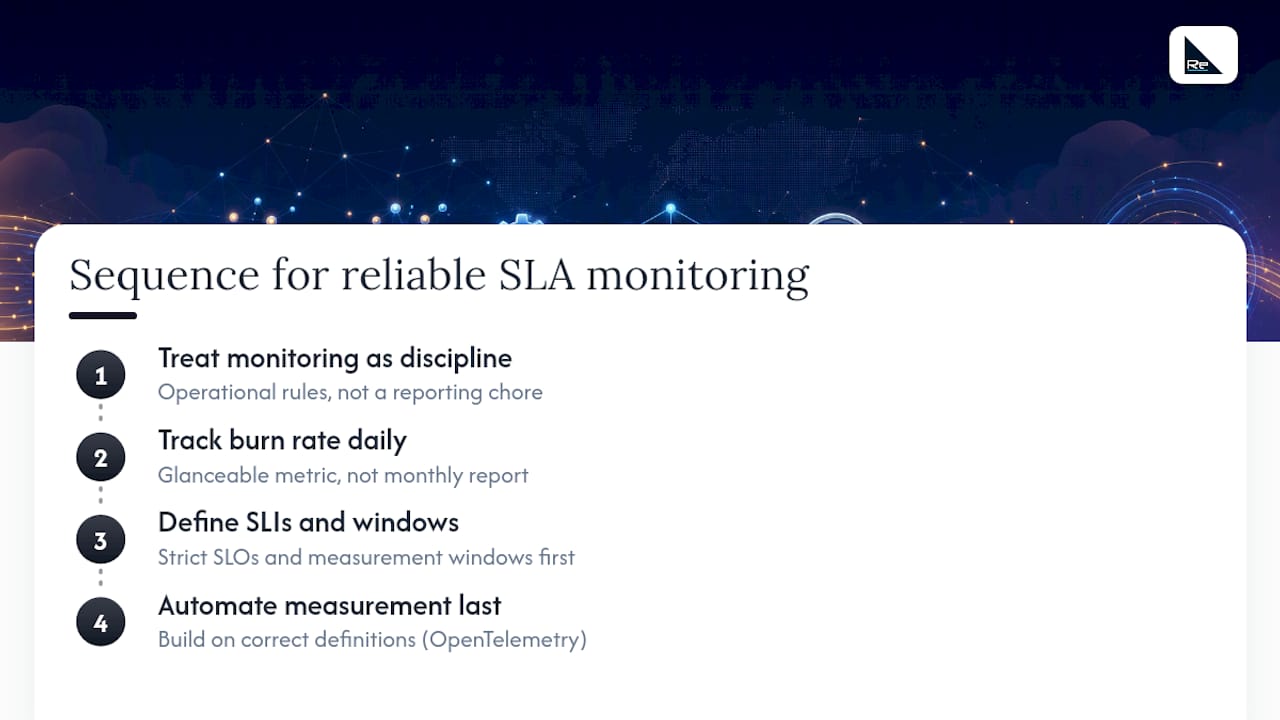
The conventional advice, “monitor uptime and review it monthly,” undersells the problem badly. Monthly review is reporting, not monitoring, and by the time a monthly report flags a breach, the contractual damage and the customer’s frustration are already done. The genuinely useful shift is treating burn rate as a daily number your team glances at the way they’d check a stock price, not a metric buried in a quarterly business review.
If there’s one priority to take from this, it’s sequencing: get your SLI definitions and measurement windows right before you automate anything. Automation built on badly defined SLIs just produces confident-looking wrong numbers faster. Define the measurement first, then let OpenTelemetry or recording rules do the arithmetic.
— Jacob
Get a network audit that turns this guide into a working dashboard
Reading about SLIs, burn rates and warning thresholds is one thing; instrumenting them across a live network estate is another. Re-solution’s network audits are built to close that gap: rather than a generic health check, an audit maps your current device coverage, latency baselines and monitoring blind spots against the SLA obligations you actually need to meet, then hands you a concrete pilot plan instead of a vague recommendation list.
For organisations juggling multiple sites, tenants, or Cisco-based infrastructure, that audit naturally leads into a managed Network as a Service engagement, where the SLI collection, burn-rate alerting and monthly reporting described throughout this guide are run for you rather than by an already-stretched internal team. If your current SLA monitoring is closer to a spreadsheet than a pipeline, get in touch to arrange a network audit and find out exactly where your coverage gaps sit before your next contract renewal.
Sources
FAQ
What is SLA monitoring?
SLA monitoring is the continuous measurement of agreed service metrics, availability, latency, packet loss, and comparison of those figures against the thresholds written into a service level agreement, so breaches can be caught and acted on before the contract period closes.
What is SLA in networking specifically?
In networking, an SLA is a contractual commitment covering measurable performance targets such as uptime, latency and packet loss between provider and customer, typically with defined service credits if those targets are missed.
What are the top network monitoring tools?
There’s no single definitive top ten; effective stacks combine synthetic monitoring, passive telemetry via frameworks like OpenTelemetry, device-side probes, and, for organisations needing self-hosted or privacy-conscious deployments, open-source prober and dashboard tools. Re-solution’s managed Network as a Service offering combines several of these methods for organisations that prefer a managed approach.
What are the three types of SLA?
The commonly recognised categories are customer-based SLAs (covering all services for one client), service-based SLAs (covering one service across all customers), and multi-level SLAs (which layer corporate, customer and service-specific terms together).
How often should SLA compliance be reviewed?
Compliance should be monitored in real time through burn-rate dashboards, while formal reporting to stakeholders typically happens monthly or quarterly, alongside the SLA’s own review cycle.
Recommended
- Top Network Monitoring Techniques 2025
- Guide to monitoring network health for reliable performance
- How to enhance network performance: 2026 IT guide
- Network automation fundamentals: a 2026 guide for IT pros